


Information is Beautiful Infographics
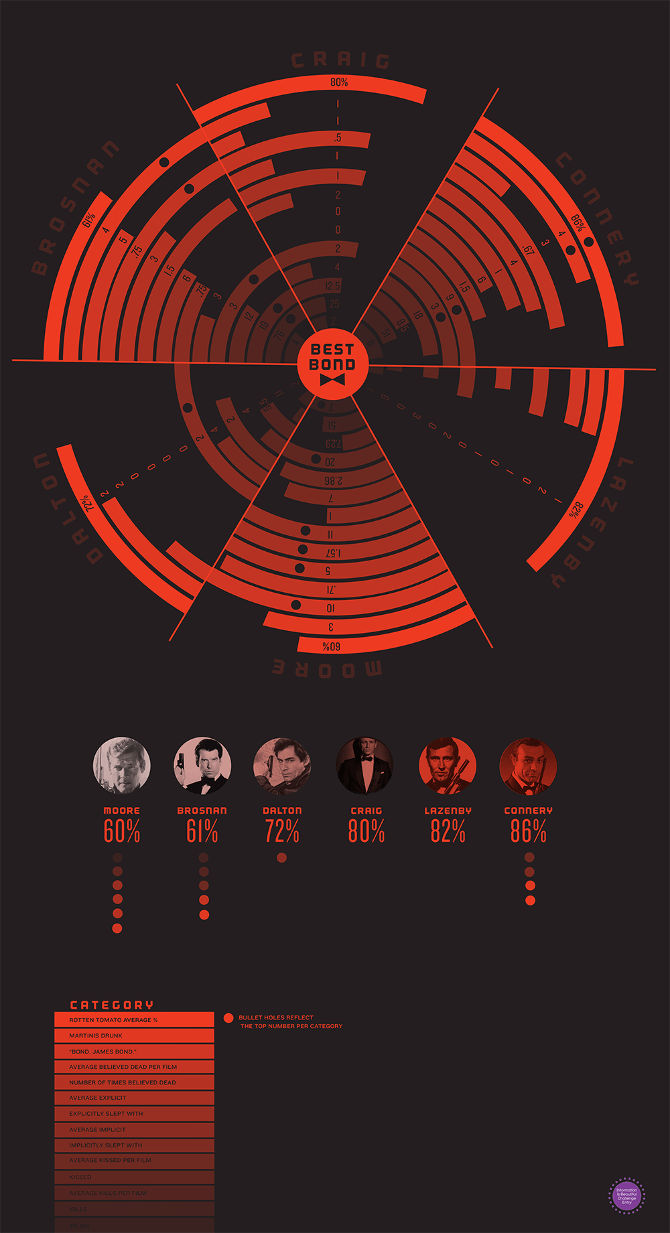
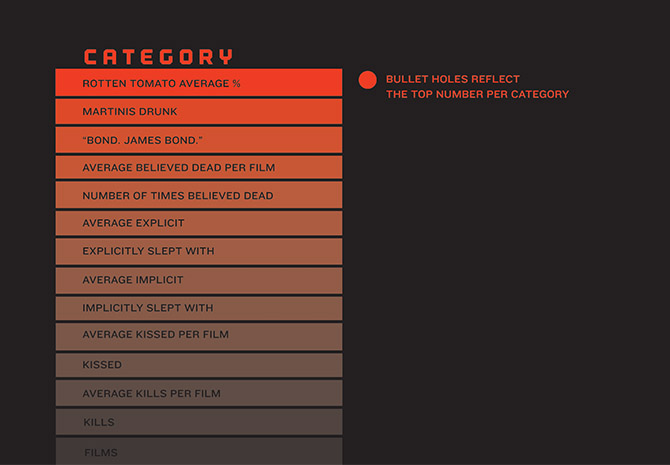
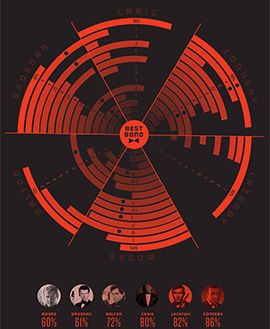
BEST BOND | This infographic compares each of the different actors that have played James Bond in order to see which actor is the most popular. Each Bond actor is laid out on a target to visually compare across categories ranging from martinis drunk to the number of times "Bond, James Bond" was said. The winner of the category is indicated by a bullet hole. The overall goal is to see whether the Bond had to win the most categories in order to be the most popular Bond actor.
Longlisted in the Information is Beautiful Design Competition 2013
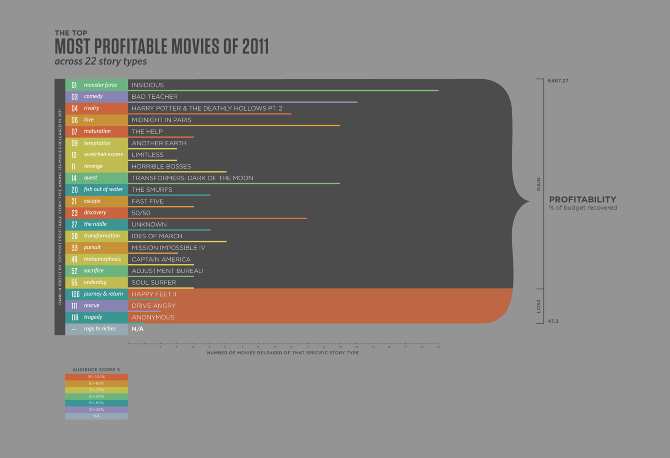
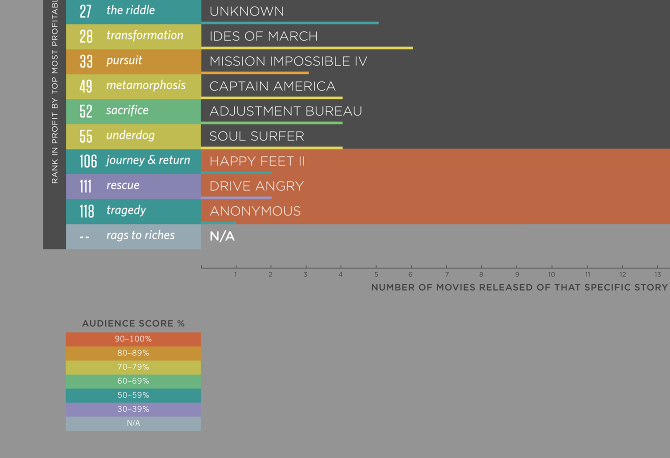
THE TOP MOST PROFITABLE MOVIES OF 2011 ACROSS 22 STORY TYPES | The brief asked designers to sort through an enormous dataset on Hollywood budgets, profits, genres, and review scores for every film from 2007–2011 and to visualize the interesting relationships that we find. I chose to explore the top most profitable movies of 2011 across 22 story types. This infographic received First Place in the Design Challenge and was the Challenge Winner in Infodesign at the Information is Beautiful Annual Awards
Received 1st Place in the Information is Beautiful Hollywood Visualizations Datavisualization Challenge and Challenge Winner in Infodesign at the Information is Beautiful Annual Awards
Select Features: iCharts, Creative Review